Trading Dashboards: Why Professionals Use Them
Learn how trading dashboards help professional traders monitor markets, track performance, and manage risk from one centralized interface.
Trading Dashboards: Why Professionals Use Them
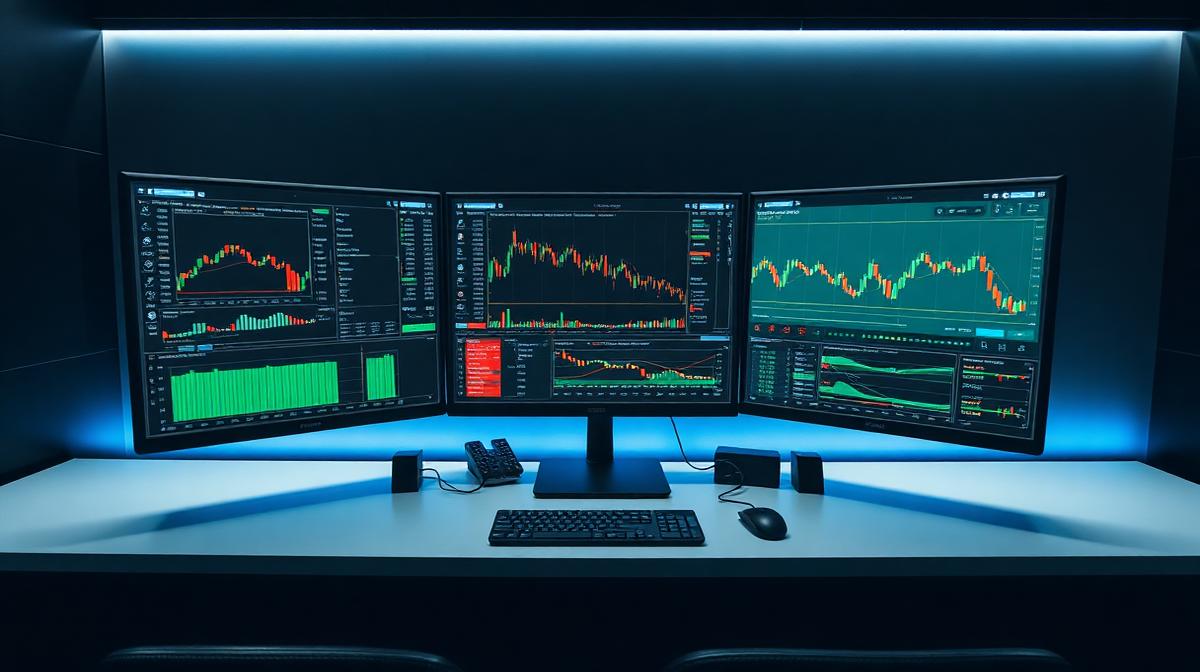
A trading dashboard centralizes the data, metrics, and visualizations that traders need to make decisions into a single interface. Rather than switching between multiple applications, tabs, and spreadsheets, a dashboard presents the most critical information in one view that can be absorbed at a glance.
What Is A Trading Dashboard?
A trading dashboard is a visual interface that aggregates data from multiple sources into a single, organized display. It centralizes market data, performance metrics, risk monitoring, and portfolio exposure, allowing traders to quickly assess their current state, monitor risk, track performance, and make informed decisions.
Professional traders use dashboards because the complexity of modern trading generates more data than any person can process through scattered sources. Price feeds, performance metrics, risk levels, economic events, portfolio exposure, and market conditions all demand attention simultaneously. A well-designed dashboard organizes this information hierarchy so that the most important data receives the most prominent placement.
This guide explains what trading dashboards are, what they should contain, and how to build or choose a dashboard that supports professional trading workflows.
🎸 Join RockstarTrader Free
RockstarTrader gives you 40+ professional trading tools in one platform — from journaling and performance analytics to risk calculators and market scanners. Everything you need to trade like a professional.
Get Started Free →Featured Snippet: Why Traders Use Dashboards
Trading dashboards centralize market data, performance metrics, risk monitoring, and portfolio exposure into a single interface. Professionals use them to reduce information fragmentation, improve decision speed, monitor risk in real time, and track performance trends. Effective dashboards display equity curves, open positions, daily P&L, risk utilization, and upcoming economic events.
Trading Dashboard Concept
A trading dashboard is a visual interface that aggregates data from multiple sources into a single, organized display. It functions like the cockpit of an aircraft, presenting all critical instruments in one location so the operator can monitor conditions without searching for information.
In trading, the dashboard concept addresses a specific problem: information fragmentation. A typical trader uses separate applications for charting, order management, news, economic calendars, journaling, and risk calculation. Switching between these applications consumes time, creates cognitive load, and increases the risk of missing critical information.
Dashboards solve this by consolidating the most important elements from each source into one view. You do not replace your charting platform or journal with a dashboard. You create a summary layer that shows the key outputs from each tool in real time.
Types of trading dashboards:
- Market monitoring dashboards focus on price data, market conditions, and upcoming events
- Performance dashboards focus on trading metrics, equity curves, and statistical analysis
- Risk dashboards focus on current exposure, drawdown levels, and position risk
- Comprehensive dashboards combine elements of all three types
The best dashboard design for you depends on your trading style, the markets you trade, and which information gaps currently affect your decision-making.
Centralizing Trading Data
The primary value of a dashboard is data centralization. When information is scattered across multiple platforms, three problems emerge.
Attention fragmentation. Switching between applications requires mental context switching. Each switch costs seconds and cognitive energy. Over a trading session, hundreds of switches accumulate into significant attention drain.
Information gaps. When data lives in separate systems, you may miss important connections. Your risk calculator shows you are within limits, but your portfolio view in a different application reveals correlated positions that effectively double your exposure. A dashboard that displays both simultaneously makes this connection visible.
Delayed awareness. By the time you navigate to your economic calendar, the high-impact news release may have already moved the market. A dashboard with an integrated event feed keeps upcoming events in your peripheral awareness at all times.
What to centralize:
- Current open positions with P&L
- Daily P&L running total
- Risk utilization (percentage of daily budget used)
- Upcoming economic events within the next 2-4 hours
- Key price levels for your watchlist instruments
- Performance metrics for the current week and month
The Economic Calendar is one of the most important data sources to integrate into your dashboard, ensuring you are never caught off guard by scheduled events.
Market Monitoring Using Dashboards
Market monitoring dashboards provide a real-time view of the instruments and conditions relevant to your trading.
Watchlist integration. Display your watchlist instruments with current price, daily change, and any alert status. This replaces the need to flip through individual charts to check whether any instrument has reached a level of interest.
Heat maps. Color-coded displays showing which instruments are up, down, or unchanged provide instant sector and market sentiment assessment. A quick glance at a heat map tells you whether the market is risk-on or risk-off without reading a single number.
Volatility monitoring. Display current volatility metrics (VIX, ATR percentiles, or custom volatility measures) prominently. Volatility affects position sizing, strategy selection, and overall risk management. The article on complete guide to trading risk management explains how volatility monitoring integrates with risk control.
Correlation display. For forex traders, showing current correlation coefficients between your active pairs prevents the concentration risk described in the forex correlation explained article.
Performance Tracking
Performance dashboards transform raw trade data into visual trends that reveal how your trading is evolving over time.
Equity curve. The single most important performance visualization. A rising, smooth equity curve indicates a functioning edge executed with discipline. A volatile, declining curve indicates problems that need investigation.
Key metrics display:
- Win rate (current period versus historical average)
- Profit factor
- Average risk-reward ratio (actual)
- Maximum drawdown (current and historical)
- Number of trades (to detect overtrading)
- Average holding time
Trend comparison. Display current period metrics alongside previous period metrics. If this week's win rate is 45% versus last week's 58%, the dashboard makes this deterioration immediately visible rather than requiring you to compile and compare numbers manually.
Goal tracking. If you set specific improvement goals during your weekly trading review, display progress toward those goals on your dashboard. Visual goal tracking maintains focus on your current improvement priority.
The RockstarTrader Trading Journal provides the data foundation that feeds performance dashboard displays, automatically calculating the metrics needed for performance monitoring.
🎸 Start Your Trading Journal
Track and analyze every trade — identify patterns, fix mistakes, grow consistently.
Open Trading Journal →Risk Monitoring
Risk dashboards provide real-time awareness of your current risk exposure and its proximity to your defined limits.
Daily risk utilization. Display how much of your daily risk budget has been used. If your daily limit is 2% and you have already realized losses of 1.5%, the dashboard shows you have only 0.5% of risk budget remaining. This visual reminder helps prevent the over-trading that occurs when traders lose awareness of their cumulative daily losses.
Position-level risk. Show each open position's current risk in dollars and and as a percentage of your account. This makes it immediately clear which positions are consuming the most risk and whether any single position is oversized.
Concurrent risk. Display the total risk across all open positions. If you have three positions each risking 1%, your concurrent risk is approximately 3%, which may approach or exceed your intended concurrent limit.
Drawdown tracking. Show your current drawdown from the account's high-water mark as both a dollar amount and a percentage. For funded account traders, display proximity to the firm's drawdown limits. The article on how to build a risk plan for prop accounts explains why real-time drawdown monitoring is critical for funded trading.
Use the Position Size Calculator in conjunction with your risk dashboard to ensure every new position fits within your remaining risk budget.
Strategy Performance Monitoring
For traders who use multiple strategies, strategy-level dashboards reveal which approaches are contributing to profitability and which are detracting from it.
Per-strategy metrics. Display win rate, profit factor, and average P&L for each strategy type you trade. This breakdown often reveals that one strategy generates the majority of profits while others break even or lose money.
Strategy allocation. Show how your trading activity is distributed across strategies. If your best strategy accounts for only 20% of your trades while an underperforming strategy accounts for 50%, the dashboard makes this misallocation visible.
Performance trends. Track each strategy's performance over time. A strategy that was profitable last quarter but has been declining this quarter may need adjustment or retirement.
Setup quality distribution. Monitor the quality of setups you are taking for each strategy. If your A-grade setups produce significantly better results than B-grade setups, a dashboard that shows your grade distribution helps you maintain focus on higher-quality opportunities.
The article on most important trading metrics explained describes the key metrics to include in strategy-level analysis.
Decision-Support Dashboards
Beyond monitoring, dashboards can actively support trading decisions by presenting relevant information at decision points.
Pre-trade decision support. When evaluating a potential trade, a decision-support dashboard displays the current currency strength readings, correlation with existing positions, upcoming events for the instrument, and your recent performance on similar setups. This comprehensive context improves decision quality.
During-trade management. While a trade is open, the dashboard shows the current P&L relative to your target and stop, how long the trade has been open, whether the risk-reward has changed since entry, and any new events that might affect the position.
Post-trade analysis. After closing a trade, the dashboard immediately shows how the result compares to your averages and whether the trade followed your plan. This immediate feedback supports the post-trade review process described in the how to perform a post-trade review article.
How Dashboards Reduce Errors
Dashboards reduce trading errors through several mechanisms.
Visibility. Information that is visible is less likely to be ignored. A risk utilization meter displayed prominently on your dashboard is harder to overlook than a mental calculation you should but might not perform.
Standardization. A dashboard that displays the same information in the same layout every day creates pattern recognition. You develop an intuitive sense of what normal looks like, making anomalies, such as unusual risk utilization or deteriorating metrics, immediately noticeable.
Accountability. A dashboard that tracks your compliance rate, the percentage of trades following all rules, creates persistent visibility of your discipline level. This visibility alone improves compliance because the consequences of violations are documented and visible.
Reduced cognitive load. By organizing information hierarchically, dashboards reduce the mental effort required to assess your current state. This freed cognitive capacity can be directed toward analysis and decision-making rather than information gathering.
Real Trading Dashboard Examples
Day trader dashboard. Displays: watchlist with pivot levels, current open positions with P&L, daily P&L total with daily limit indicator, upcoming economic events within 2 hours, current volatility level, and number of trades taken today versus daily limit.
Swing trader dashboard. Displays: portfolio positions with unrealized P&L, weekly equity curve, sector exposure breakdown, correlation matrix for open positions, approaching earnings dates for held positions, and weekly performance metrics.
Funded trader dashboard. Displays: account balance relative to starting balance, current drawdown percentage with firm limit overlay, daily P&L relative to daily loss limit, number of trading days completed, profit progress toward target, and rule compliance checklist.
Each example prioritizes different information based on the trader's specific needs and constraints.
Building Your Own Trading Dashboard
Building an effective dashboard requires thoughtful design rather than simply displaying every available metric.
Step 1: Identify your information gaps. What questions do you currently answer by switching between applications? What information do you sometimes forget to check? These gaps define what your dashboard should display.
Step 2: Prioritize by impact. Rank your information needs by their impact on trading decisions. Risk utilization and daily P&L are high-impact. The exact time of a news release three days from now is low-impact. High-impact items get prominent placement.
Step 3: Design for glanceability. The best dashboards communicate their most important information in under three seconds. Use color coding, progress bars, and numerical summaries rather than dense text or complex charts.
Step 4: Start simple. Begin with five to eight components and add more only if you identify specific gaps. An overcrowded dashboard is as problematic as no dashboard because critical information gets lost in the noise.
Step 5: Iterate based on usage. After using your dashboard for two weeks, evaluate which components you actually reference and which you ignore. Remove unused components and refine the ones you rely on.
The RockstarTrader platform provides integrated trading analytics and performance tracking that forms the foundation of a professional trading dashboard. Combine it with the complete tools directory to build a comprehensive professional workflow.
FAQ
What should a trading dashboard include?
At minimum: current open positions with P&L, daily P&L total, risk utilization, upcoming economic events, and key performance metrics (win rate, profit factor). Add additional components based on your specific needs.
Do I need a custom dashboard or can I use existing tools?
Many trading platforms and journal applications include built-in dashboard features. Start with these before building custom solutions. Custom dashboards are worthwhile only if existing tools do not meet your specific needs.
How often should I look at my dashboard?
Glance at your dashboard every 15-30 minutes during active trading sessions. Check key metrics like risk utilization before every new trade. Review performance dashboards during daily and weekly reviews.
Can dashboards replace a trading journal?
No. Dashboards display summary information for real-time monitoring. Journals provide detailed trade-by-trade recording and qualitative analysis. They serve different purposes and both are essential.
What is the biggest dashboard design mistake?
Overloading with too much information. A cluttered dashboard becomes noise that traders learn to ignore. Focus on five to eight critical components with clear visual hierarchy.
Conclusion
Trading dashboards are indispensable tools for professional traders, centralizing critical market data, performance metrics, and risk exposure into a single, digestible interface. They combat information fragmentation, speed up decision-making, enhance real-time risk monitoring, and provide essential insights into trading performance. By carefully selecting and prioritizing components, traders can build or customize dashboards that significantly reduce errors, improve discipline, and support a more efficient and effective trading workflow. Incorporating tools like economic calendars, position size calculators, and integrated journaling data helps create a comprehensive and powerful trading environment that adapts to individual trading styles and goals.
Related Resources
- Trading Journal — Data foundation for dashboards
- Economic Calendar — Essential for event monitoring
- Position Size Calculator — Critical for risk management
🎸 Join RockstarTrader Free
RockstarTrader gives you 40+ professional trading tools in one platform — from journaling and performance analytics to risk calculators and market scanners. Everything you need to trade like a professional.
Get Started Free →Ready to level up your trading?
Track, analyze, and improve your trades with RockstarTrader's trading journal.
Start Free Trial

